Massive stars are the primary chemical and dynamical drivers of the Universe and are crucial for interpreting phenomena in high-redshift galaxies. Understanding the early reionization epoch, the formation of the first galaxies, the transition to Population II metallicities, and the rates of very luminous supernovae, gamma-ray bursts, and gravitational waves requires a deep knowledge of the most massive stars ever formed. However, the formation and evolution of these very massive stars remain uncertain. This gap in understanding extends to star formation studies in galaxies where individual stars cannot be resolved, blurring the conclusions drawn from such studies. Therefore, it is essential to understand the evolution and formation of the most massive stars in the Milky Way and Local Group before extending our research to more distant galaxies.
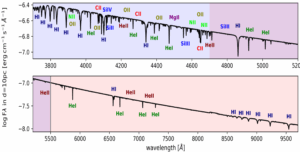
Fig. 1. Spectrum of an O star marking the most relevant lines in the BlueMUSE (blue) and MUSE (red) wavelength ranges, with an overlap zone.
Systematic spectroscopic analysis of the most massive star clusters is fundamental for addressing this problem, as it helps to confirm or challenge current stellar evolutionary theories. However, this process is both resource-intensive and incomplete. Spectroscopy of massive stars in star-forming regions is notoriously challenging due to nebular contamination and crowding, and assembling large spectroscopic samples requires significant observing time.
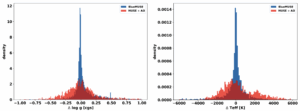
Figure 2. Comparison of extracted parameters from mock BlueMUSE and MUSE-AO data cubes of a 30Dor-like system. Both data cubes were simulated by BlueSi software, accounting for all instrumental properties, including the rectangular spaxels for BlueMUSE. Observing conditions were the same, with a natural seeing of FWHM=0.8″ (for BlueMUSE) and an GLAO correction to PSF FWHM=0.6″ for MUSE. The data cubes were analysed in the standard manner (e.g. using PampelMUSE to extract stellar spectra). The extracted values were compared with the input values. Left: histogram of the difference between extracted and input the surface gravity. Right: histogram of the difference between extracted and input temperature. The increased precision of the BlueMUSE measurements is due to the higher spectral resolution and a larger number of lines in the blue part of the spectra of massive stars.