| Characteristic | Value |
| wavelength range (extended) | 350 – 580 (330 – 600) nm |
| spectral resolution | R>2600, average R=3500 over the wavelength range |
| throughput | > 15%, average > 26% over the wavelength range |
| field-of-view | 1 arcmin2 |
| spatial sampling | 0.2″ < spaxel < 0.3″ |
| spectral sampling of the LSF | > 2 spectral pixels (1.32 Å) |
Spatial properties: the spatial sampling of BlueMUSE is adapted to the natural seeing expected at blue wavelengths on Paranal. It will have rectangular spaxels of approximately 0.2″ x 0.3″ size (an aspect ratio of 1:1.5), mapping about 1’x1′ field-of-view. The spaxel size ensure that the expected natural seeing of 0.6″ at 580 nm will be sampled by at least 2 pixels, and more at lower wavelengths. The larger spaxel area has a useful property that ensures BlueMUSE will be background limited for executions time longe than 15-20 min, allowing efficient observations of faint structures and cosmological deep fields. Tests show that rectangular pixels will not have a noticeable influence on the shape of the PSF for any reasonable natural seeing (Fig. 1)
Spectral resolution and the LSF: BlueMUSE spectral resolution varies with wavelength, starting from R~2600 at 350 nm, reaching the average value of R~3500 at 465 nm and achieving the final values of R~4350 at 580nm. With these values, BlueMUSE’s spectral resolution is more than a factor of two higher than that of MUSE, at any common wavelength. The spectra will be dispersed over pixels covering 0.66 Å, while the line-spread function (LSF) will be sampled with at least two pixels, such that the Nyquist sampling condition is fulfilled. The actual sampling will differ across the field, with expected 2.1-2.2 pixels. this means the FWHM of the LSF will be ~1.32 -1.45 Å over the field of view.
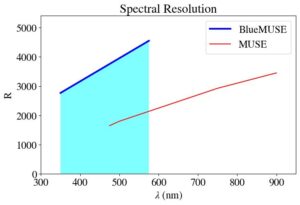
Figure 1. Comparison of BlueMUSE (blue curve) and MUSE(red curve) spectral resolution as a function of wavelength.
Blue spectral range: BlueMUSE is optimised for observations between 350 – 580 nm. This spectral range is optimised for studies of massive stars, interstellar medium and its nebule (HII regions, PNe), low metallicity (unresolved) stellar populations, star forming regions, as well as the objects found at the “cosmic noon” epoch, and their circumgalactic medium. Next to the covering the spectral range that is specific for stellar population studies and opening a redshift range, not accessible to red optimised instruments, the blue wavelength range is also characterised with little or no sky lines and low sky background, allowing a generally higher precision in determination of measured physical properties.
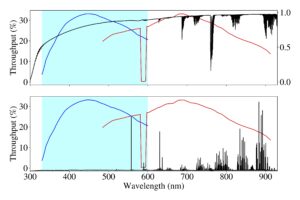
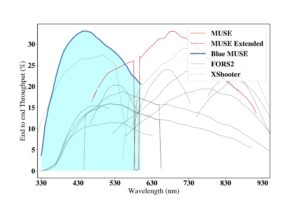
Figure 2. Comparison between BlueMUSE (blue) and MUSE (red) wavelength ranges and end-to-end sensitivities, plotted together with the atmospheric transmission (top panel) and sky emission (bottom panel).
High Sensitivity: BlueMUSE is optimised to have high sensitivity at blue wavelengths. Its peak throughput will reach ~35% (end-to-end including atmosphere and telescope) at around 430 nm, while the average throughput will be >30% within the nominal spectral range (350 – 580 nm). This will make BlueMUSE the highest sensitivity spectrograph at the VLT. In comparison with MUSE, BlueMUSE will have a similar peak and somewhat higher overall throughput, but it will be more than 1.5 time more sensitive at the bluest MUSE wavelength. This will have a notable influence on the overall performance and efficiency of BlueMUSE, even in comparison with AO assisted observations. For example, observing at 500nm (e.g. [OIII]) with BlueMUSE is expected to be 3x faster than with MUSE+AO. The reason for this is traced to the higher spectral resolution and a 40% excess in the end-to-end transmission for BlueMUSE, in spite of the ~20% increase in image quality for MUSE due to AO.